Peptide dosing charts aren't something you wing. If you're serious about performance optimization, you need exact numbers: how much powder to reconstitute, how many units to draw, when to inject, and how to scale your dose safely over time.
This guide breaks down everything you need to know about reading, using, and building your own peptide dosing charts so you can dial in your protocol with precision.
Related: Peptide Dosing Schedule: Complete Protocol Guide for Athletes
Related: AOD Peptide Dosing: Complete Guide for Athletes
What Peptide Dosing Charts Actually Do
A peptide dosing chart is a reference tool that maps three critical pieces of information: the amount of powder in your vial, the volume of bacteriostatic water you add, and the final concentration that results. From there, you can calculate exactly how many units on an insulin syringe equals your target dose.
Without a chart, you're guessing. And guessing with peptides means inconsistent results, wasted material, and potential safety gaps.
The best charts include titration schedules too. This shows you how to start low, assess tolerance, and gradually increase your dose over days or weeks. This is non-negotiable for safe peptide use.
Understanding Reconstitution Math
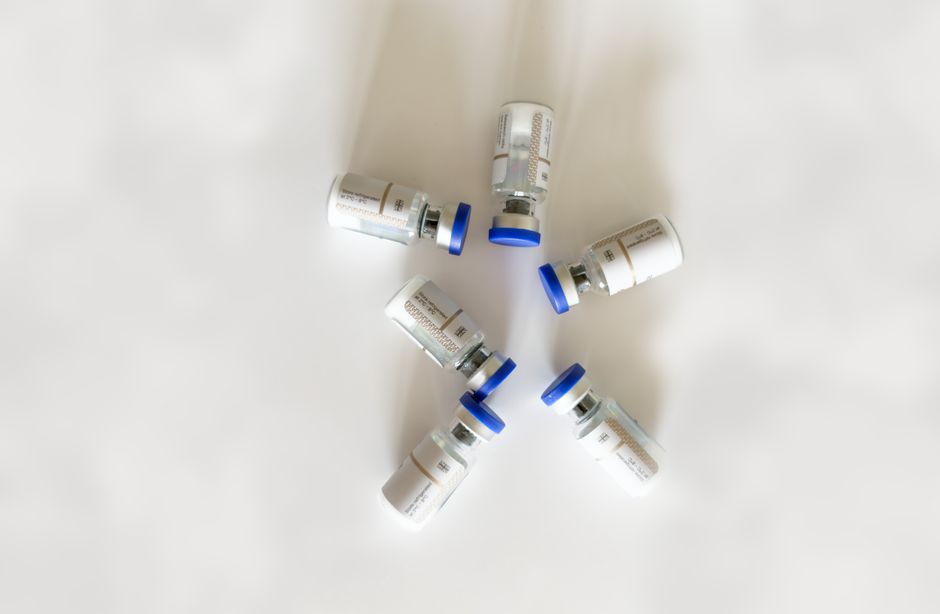
Reconstitution is where most people get lost. You have a powder vial (usually 1mg, 5mg, or 10mg). You add bacteriostatic water. The result is a liquid you can measure and inject.
Here's the formula:
- Total peptide in vial (in micrograms) ÷ volume of bacteriostatic water added (in milliliters) = concentration per milliliter
Example: A 5mg vial with 5ml of bacteriostatic water gives you 1mg per ml, or 1,000 mcg per ml.
An insulin syringe typically measures in units. On a 100-unit syringe, 1 unit = 1/100th of a milliliter. So in the example above, drawing 10 units = 100 mcg of peptide.
A solid peptide dosing chart pre-calculates this for you so you don't have to do math every injection day.
Common Peptide Dosing Ranges
Dosing varies widely by peptide type and your goal. But here are typical ranges you'll see:
- 200-500 mcg per day for subcutaneous injections
- 1-2 mg daily for higher-capacity protocols
- Starting doses often begin at 50-100 mcg to assess tolerance
- Frequency ranges from once daily to twice daily depending on the peptide
Your dosing chart should list these ranges clearly so you know where you're starting and where you might progress.
Building Your Titration Schedule
Titration means starting low and increasing gradually. This lets you catch any sensitivity issues early and find the dose that works best for your body.
A basic titration schedule looks like this:
- Week 1: 50-100 mcg daily
- Week 2: 100-150 mcg daily
- Week 3: 150-250 mcg daily
- Week 4+: Target maintenance dose
Your dosing chart should have space to log each week's dose and any observations (energy, side effects, performance metrics). This creates a record you can reference for future cycles.
If you're not comfortable building this yourself, NinjAthlete offers science-backed peptide therapy protocols that include pre-built titration frameworks so you're not starting from scratch.
Injection Technique and Syringe Selection
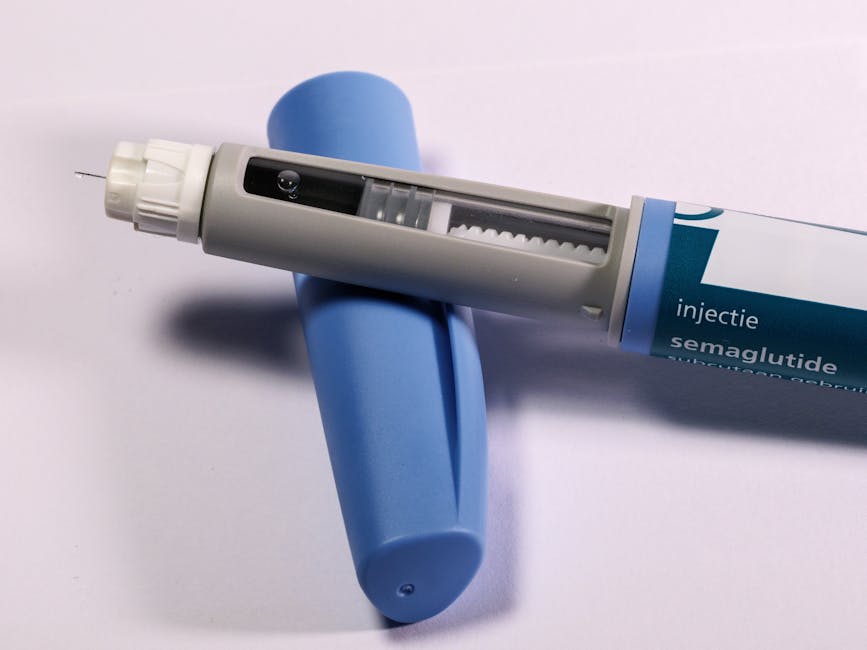
You need a calibrated insulin syringe. 100-unit syringes are standard because they give you fine-grained control over small volumes. A 50-unit syringe can work if your doses are higher, but 100-unit gives better precision.
Your dosing chart should specify which syringe to use and mark the exact unit increment for your target dose. Example: "For 150 mcg dose, draw to the 15-unit line on a 100-unit syringe."
Subcutaneous injection sites rotate: abdomen, outer thigh, and lower back are standard. Document your site rotation in your chart so you're not injecting the same spot repeatedly.
Reconstitution Table Reference
Here's a quick reference for common vial and water combinations:
| Vial Size | Bacteriostatic Water | Concentration per ML | Units for 100 mcg |
| 1mg | 1ml | 1,000 mcg/ml | 10 |
| 5mg | 5ml | 1,000 mcg/ml | 10 |
| 5mg | 2.5ml | 2,000 mcg/ml | 5 |
| 10mg | 10ml | 1,000 mcg/ml | 10 |
These are the most common setups you'll encounter. Your actual chart should include the specific concentrations you're using.